
Case study · Our own application
Every train, bus and ship on one live map
Argus Eyes joins a dozen public data feeds into one picture of what is moving across Britain. We designed it, built it and run it ourselves.
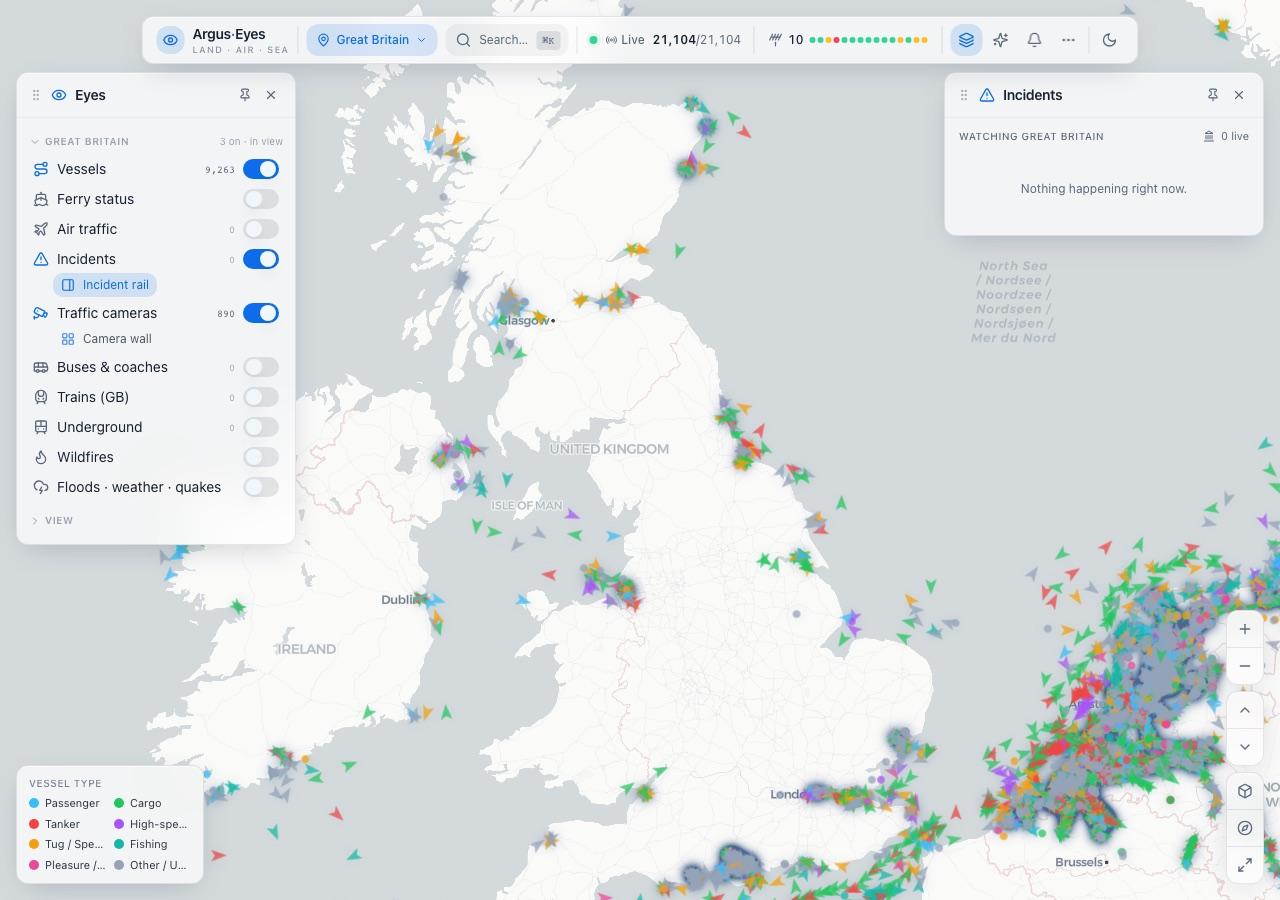
The short version
Ten browser tabs, turned into one map
Nobody can hold ten tabs open and call it awareness. Argus Eyes puts the same public information in one place and lets you build the picture you need.
- Problem
- The feeds that describe what is moving across the country are all public and all separate: ships, trains, the Underground, buses, traffic cameras, road incidents, flood and weather alerts. Each is a different shape arriving at a different rate.
- Built
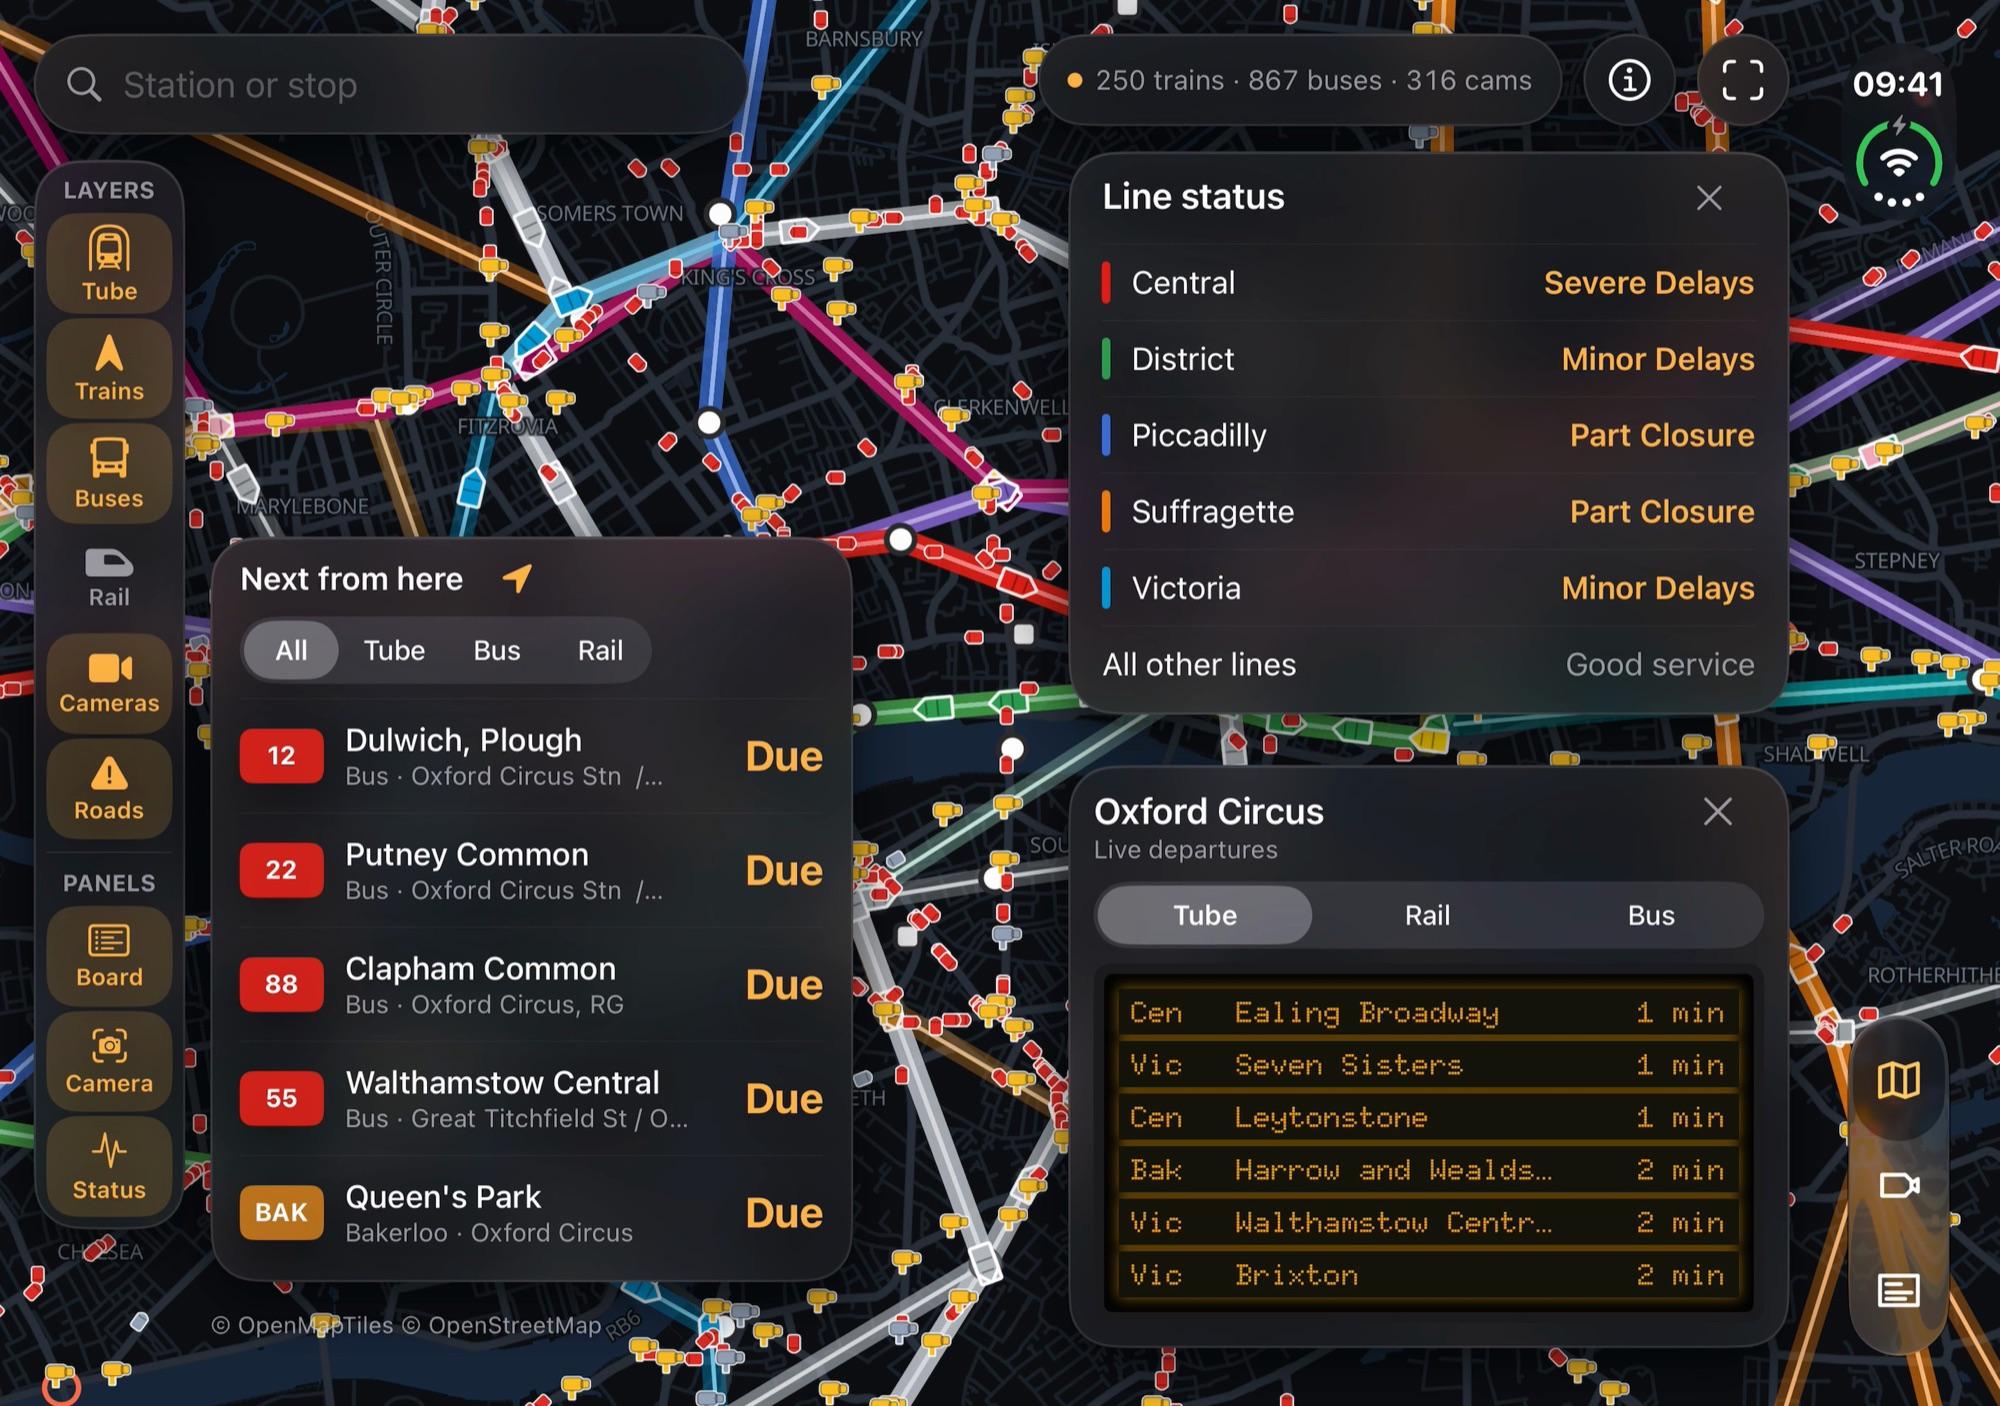
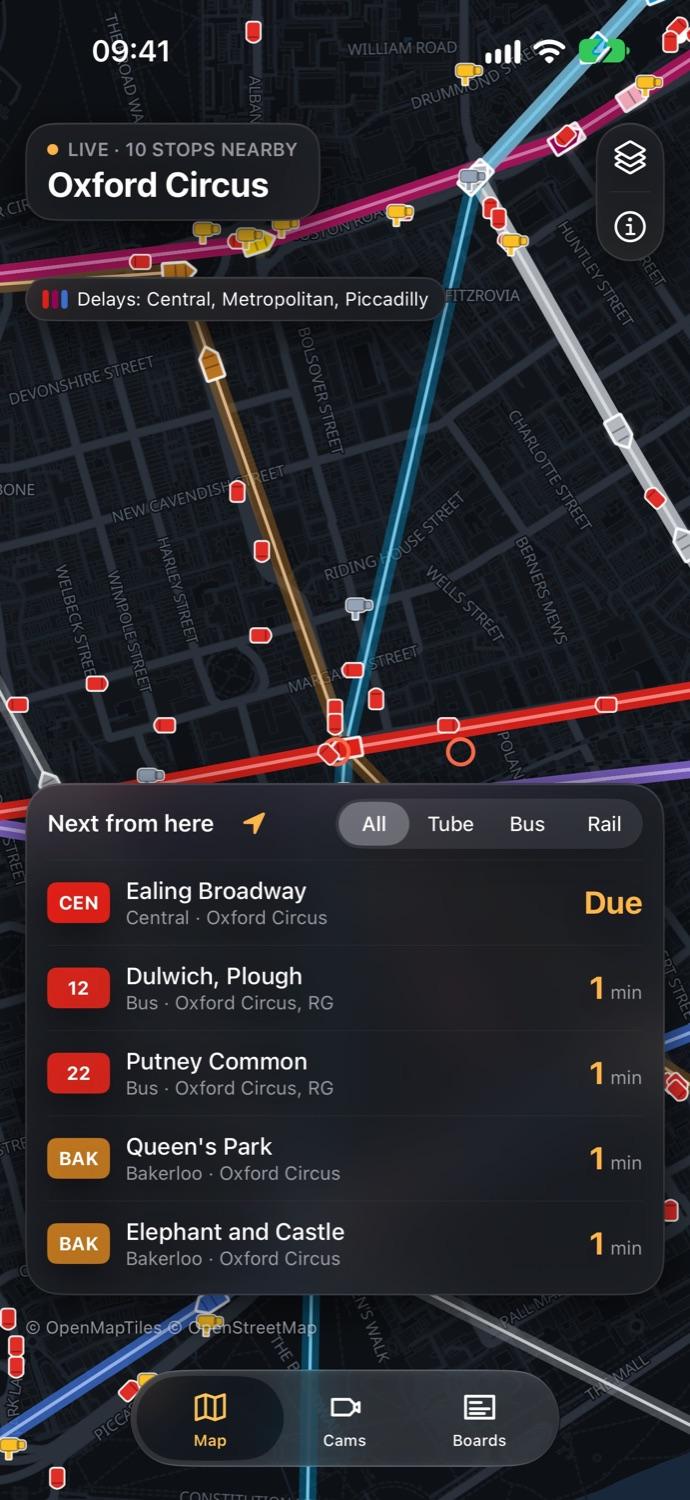
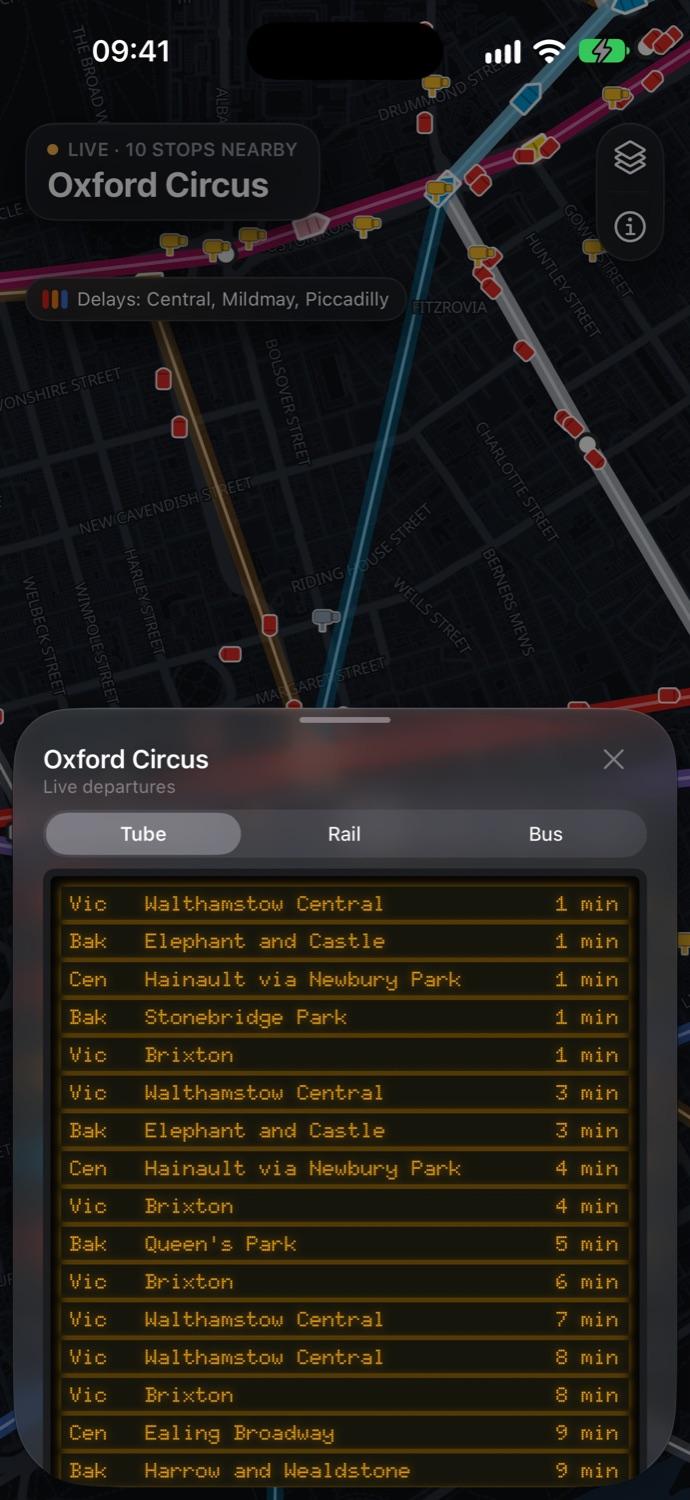
- One live map with every feed as a layer you switch on or off, departure boards for every station and stop, and a wall of traffic cameras. A web app for the whole of Great Britain and a native iPhone and iPad app for London.
- AI used
- An analyst you can ask about the live picture in plain English. It answers only from what the data returned, shows which sources it used, and moves the map to what it found.
- Result
- On an ordinary weekday morning the web map held 21,104 tracked objects, 9,263 of them ships, alongside 890 traffic cameras, and stayed usable on a laptop while they all moved.
How it works
From a dozen feeds to one moving picture
- 01Public feedsShip positions, train movements, bus GPS, Underground arrivals, cameras and alerts, each in its own format.
- 02One connection eachThe server holds a single connection to every feed and reconnects by itself, however many people are watching.
- 03One pictureEverything is normalised into a single in-memory picture. Anything that goes quiet is dropped after a few minutes.
- 04Only what changedAbout once a second, each browser or phone is sent the changes inside the area it is looking at, and nothing else.
- 05Drawn on the GPUThe map draws thousands of moving markers in one pass, so it stays smooth on a phone.
On iPhone
The same data, designed for a pocket
What it taught us
The parts that were hard
01Trains without GPSThe Underground publishes arrival times, not positions. We work out where each train must be from its predictions and place it on the real line geometry.
02Be a good neighbourOpen data comes with rate limits. One upstream connection shared by every visitor keeps us inside them at any audience size.
03Private by designNo account, no adverts and no tracking. Location is optional, rounded to about 100 metres and never stored.
04AI that shows its workingThe analyst may only state what the data tools returned in that conversation. If the data does not say it, neither does the model.
Powered by TfL Open Data. Contains National Rail Enquiries data. Bus data from the Bus Open Data Service. Map data © OpenStreetMap contributors. Argus Eyes is independent and not affiliated with Transport for London or National Rail.